PV Fleet Data Initiative
| Project ID | 03b2e844-1fda-4725-9edc-ba09b4ca8a79 |
|---|
PV Fleets Data Initiative
DuraMAT Adjacent Project
Operational Field Studies

Overview
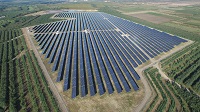
The U.S. Department of Energy (DOE) Solar Energy Technologies Office has launched the Photovoltaics (PV) Fleet Performance Data Initiative to support the U.S. PV community by pooling plant operation data in a central database and providing a performance assessment of individual solar assets using standardized state-of-the-art methods. The analysis results will provide PV plant owners and operators with a confidential, detailed assessment of the performance of their fleet and give the broader community an aggregate benchmark for the performance of the solar fleet in the United States. These outcomes will enable more efficient operation of PV installations and improve financial assessment accuracy for current and future PV power plants.
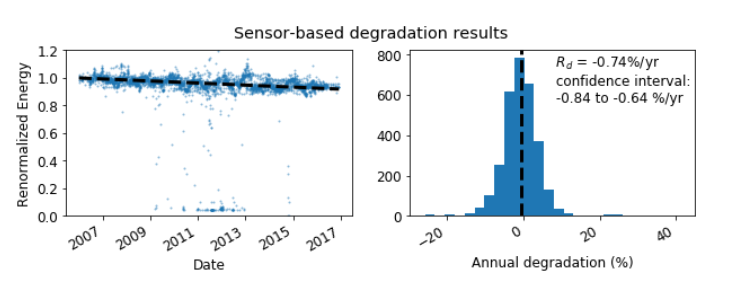
Figure 1 - An example of the RdTools analysis package output for a single system analyzed from ten years worth of time-series data
The initiative uses alternating-current power output data from medium and large (>250 kilowatts) PV installations over at least three years with a minimum resolution of 15 minutes, together with on-site plane-of-array irradiance, meteorological data, and system specifications. The performance assessment is carried out using RdTools, a set of open-source tools written in Python. Research and collaboration with industry has shown RdTools to be a promising method for calculating plant-level module degradation rates, as well as performance impacts by soiling, inverter clipping, and plant availability. It is envisioned that the analysis will provide system-level evaluation of individual PV plants, including degradation rates and events affecting the plant performance, and compare the performance of a specific power plant to an aggregate benchmark.
Current Fleet Data
Data Hub Fleet Data Repository - The current information about anonymized data from the fleets analysis.
Photovoltaic Degradation Fleets Insight Data (2022.02.02) - DOI: 10.21948/1842958 - A link to the CSV of the latest Fleet results data.
PV Fleets / PVDAQ Public Data Site - A link to the PVDAQ interactive website for public data set exploring and downloads.
Other important links:
Rd Tools - RdTools is an open-source library to support reproducible technical analysis of time series data from photovoltaic energy systems.
PVAnalytics - PVAnalytics is a python library that supports analytics for PV systems. It provides functions for quality control, filtering, and feature labeling and other tools supporting the analysis of PV system-level data.
RTC PV Performance Data - DOI: 10.21948/1811521 - Data containing performance data measured for flat-plate photovoltaic (PV) modules installed in Cocoa, Florida; Eugene, Oregon; and Golden, Colorado; including PV module current-voltage curves and associated meteorological data for approximately one-year periods.
Detecting Data Shifts - DOI: 10.21948/1874783 - Simulated datasets for detect data shifts in time-series data.
Detecting Inverter Clipping - Simulated Data - Datasets for training tools to detect inverter clipping in PV time-series data.
Detecting Inverter Clipping - Real Data - DOI: 10.21948/1874779 - Anonymized datasets for training tools to detect inverter clipping in PV time-series data.
Example Soiling Signal Data - A time-series dataset with example soiling signals. Used to help validate software being developed to detect soiling at PV sites.
PV Site Satellite Image Detection and Validation - DOI:10.21948/1737786 - A training set used to identify and discover pointing parameters for a PV array site.
PV Panel Segmentation Training Set - DOI: 10.21948/1867572 - This data set includes labeled solar array configuration/type satellite images. Data is provided in training, test, and validation folders, and is used by the NREL Panel-Segmentation software package to detect and classify solar mounting configuration and type in satellite imagery.
Clear sky Labeled Time-Series - DOI: 10.21948/1874985 - This data set contains labeled clearsky periods for 1 minute-interval data for the NREL Sanyo 1 system.
Recipient None (PI: Deline, Chris)
Status On going